support@evergreenstrategicsystems.com
Overwhelmed Visionary AGENCY OWNERS With Remote Teams
Take An "Off The Grid", Stress Free Vacation Anywhere In The World in Just 90 Days
I will fix your operations with systems, remove you as the bottleneck, and empower your team to take over your business with my 90 Day Vacation Ready Sprint.
Watch THIS VIDEO TO SEE HOW WE DO IT
Ready To Start Planning Your Dream Vacation?
TESTIMONIALS
Here Are Real Results
"I'm no longer the bottleneck. The team owns their work. I can finally breathe."
Lewis Vandervalk - Blue Crocus Solutions

“It’s given me peace of mind… I can go to sleep at night and not feel like I’m the one that has to have my hands in everything for this business to survive.
Seth Brown - Surge Digital
"It’s just a relief because now every single morning I know things are handled, and I have more time to work on what drives the business forward.”
Mark Petree - Limo Marketer
“We have team members that are doing things on their own outside of us… Our operations are taken care of. This is literally all as a result of working with you.”
Carson Brown - Surge Digital
“Today, we’re offering our services for $30,000 for clients, which literally hasn’t happened before. It’s because now we have the trust on our delivery, on our systems, and on our operations in the back end.”
Roland Bernath - Personal Brand Machine
“Now we have very solid systems that are super reliable. Everyone has extreme ownership in their department and I’m able to go and focus on the revenue-generating activities.”
James Donovan - NineTwo Media
"Another really important thing that you’ve helped us do, and possibly the most important thing, is helped us with the outsourcing of the work. I mean, that has been absolutely tremendous."
Stephen and Michael - 7 Wonders Cinema
“If you have a problem that you can’t figure out in your business… or if you’re at a revenue plateau and not sure how to break through… Brett’s done an incredible job helping us progress to the next level”
Charlie Price - Cardinal Thrive
Ready To Scale?
I’ll Tighten Your Operations So You Can Take An “Off The Grid”, Stress Free Vacation Anywhere In The World in Just 90 Days
(or I’ll pay for your plane ticket)

Dear Creative Visionary Agency Owner,
Here is my promise to you:
If you feel stuck in your business operations, I will remove you as the bottleneck, add systems, and empower your team to take over your business with my 90 Day Vacation Sprint.
By the end of this sprint, you will be confident to board your flight… every loose end accounted for, every detail delegated to your team. You’ll be free to unplug, refresh, and prepare for the next phase of growth with a systemized business.
Read to the end of this letter to know my exact philosophy, why you're stuck, my proven process that gets results, how to be more profitable, and how to apply to work with me.
If running your business has you stressed, sleepless, and working 60+ hours a week…
If you’re missing time with your family, feeling overworked, frustrated with a B level team, and stuck in what feels like a dumpster fire….This is for you.
In fact, you may have the same thoughts of my past clients. Thoughts like:
“It still feels like I am holding every single ball in the air.”
“Feels like this whole thing is an absolute dumpster fire… looks pretty from the outside, but on the inside it’s a mess.”
“I’m averaging three to five hours of sleep a day.”
“I ended up doing everything anyway… I got really, really burned out.”
“We had a six-figure launch and I made negative $700… because of the team.”
“Anytime something happens… (my team) is always calling ME.”
“I want to be able to disappear for a few days. But I don’t want to come back to a shit show.”
“I wake up anxious every day.”
“I’m working 60-hour weeks and projects are still stuck.”
“I’ve been waking up at 2am in sweats all week”
If any one of these sound familiar, you’ve neglected operations enough.
It’s causing you to not be your best.
You aren’t thinking straight. You’re burning all your energy just to keep things from collapsing, and it feels like there’s no way out.
You didn’t start a business to feel this way, to be stuck on a treadmill.
You want a business that can grow without you. One that brings you more happiness and internal fulfillment than an endless conveyor belt of problems.
Well, I want to show you the surefire, fastest way to get you from where you are now to where you want to be.
The 2 Steps To Get Your Momentum Back
There are two things you need to do to get there:
1. You need to recharge your battery. You built this business. You can build it bigger. You just need to get your head clear to do so.
But if you left today, you’d be anxious, nervous, constantly checking slack, and likely come back to a bigger mess than you would have had you stayed.
That means you need to fix underlying problem:
2. You need to fix your business. You have hidden and complex operational issues that have run wild, growing worse each day, and are ultimately keeping you stuck.
If you can identify these hidden obstacles causing these problems that are keeping you stuck, and fix them at the root, you would be free to take a break and get your head straight.
Luckily, I can help.
Not only did I experience this myself in my own business, and ultimately fixed it to make it self running.
I’ve since obsessed over this problem, serving as a fractional COO for 50+ online founders with remote teams to help fix just this.
And in every case, I found the same 7 systemic issues keeping founders like you stuck.
The 7 Things Keeping You Stuck
Here are the 7 hidden reasons you feel stuck in your business:
Issue 1: You don’t actually know what your team is doing
Who’s doing what? When do they start it? When do they check it off? Proof that it’s done. All questions you aren’t 100% sure on. No one is actually an owner of their roles!
Issue 2: You have no single source of truth or high-level perspective
You just want one holistic place where I can see what the f*ck’s going on in your agency. Because right now it’s freaking everywhere.
Issue 3: You are the default (micro) manager
Anytime something bad happens, your team is calling you, the owner, rather than taking ownership or automatically reporting to a competent number 2.
Issue 4: Everything is stuck in your head and your team’s heads
You still feel like you are holding every single ball in the air. And your team operates in silos.
Issue 5: Problems never get solved at the root
While your business looks pretty from the outside, it feels like an absolute dumpster fire and tangled mess when you get on the inside.
Issue 6: Your documentation is out of date and ignored
You don’t have a comprehensive knowledge base, SOP’s aren’t updated, and you're not sure anyone even follows the SOP’s anyway.
Issue 7: You’re missing critical skills and roles on your team
Your working 60 hour weeks, sleeping 4-5 hours a night doing everyone else’s job.
Here's the secret: If you can successfully fix these 7 issues, you will have a self running business, and the freedom that comes with it.
So, why aren't these fixed yet? There are 4 reasons:
1) You don't know HOW to fix them
2) You don't have the TIME to fix them.
3) You don't have the PERSPECTIVE to fix them (you are IN the system)
4) You are not the right authority to CHANGE the existing culture
This is true for anyone needing any service – just like you deliver for your clients. You need outside help and a proven system to bring change!
Thankfully, that’s exactly what my 90 Day Vacation Ready Sprint does.
This is a one time catalyst that will stabilize your business operations, empower your team to take over for you, and lay the foundation for you so you can take your business to the next level.
My 90 Day Vacation Ready Sprint That Will Change Your Life
Look. Your business isn’t personal. It’s math. Fix the geometry and you fix the profits.
What I do is come in, fix the math for you, and empower your team to take over the business. That’s my secret.
Here’s how my 90 Day Vacation Ready Sprint works in 4 simple steps:
Team buy in: I will get absolute buy in from your team to take ownership, and will extract all info out of them (this is what I do best - I can ask them the questions you can’t). I'll also assess missing roles.
Wireframe. My team and I will build a wireframe of your business using our proprietary 4D Operations Model, so that we have a single source of truth and high level, out of the weeds perspective
Find all gaps and fix. My team and I will create a list of all gaps, issues, and opportunities found, and I will hold your team accountable to fixing them for you week in and week out.
Delegate and document: We will delegate the places you are stuck, and hold your team accountable to updating your knowledge base
And the best part is that it’s made easy for you. You literally just show up to a 90 minute team zoom call once a week, answer questions you already know the answer to, and I’ll do the rest.
We’ll use the labor you’re already paying for to actually do work on your business without you having to do it all yourself. They will be empowered and energized to get behind you (and this is the reason why I LOVE doing this!)
In fact, by the end of this 90 days, you will see these change:
Team Accountability: You'll know exactly what everyone on your team is SUPPOSED to do, WHEN they are supposed to do it, and have CONFIRMATION they actually did it.
Clear Perspective: You'll have a birds-eye view perspective on your business that both you AND your team can align to. A source of truth.
Team of Owners: You'll have an empowered team with an ownership mentality. And we'll remove you as the default micro-manager.
You, Unstuck: You'll know exactly where you are stuck in the business, and I'll help delegate it away for you.
Issues, Systemized: We'll turn the issues that have been plaguing your business for years into systems that keep your business moving forward.
Updated Documentation: We will update and refresh your SOP’s, make team handoffs clear, and ensure a hit-by-a-busable business (and even AI ready)
Real ROI: You’ll make your investment back not only with your time back, but with longer client retention, and operational efficiency to take on more clients.
And not only that, after your trip, you will come back clear headed with new ideas, and with momentum, ready to take your business to the next level, with systems, team, and clarity in tow.
Real Results of My 90 Day Vacation Ready Sprint
Look, it sounds too good to be true, but I promise you it’s not. You can be confident to take a stress free, “off the grid” vacation in just 90 days, and be refreshed and ready with momentum to drive your business ahead.
It’s no joke!
Here are quotes from real clients after going through their sprint:
“Brett helped us fix years of stagnation in just 60 days. My team now runs without me, and we’re scaling faster.”
“You gelled the team in the first few calls. You brought people together and asked the right questions to get to the root.”
“Our business looks night-and-day different… It feels like we’re actually running a business now.”
“I finally bought back my time and gained peace of mind. That’s nearly priceless.”
“One of the best returns on investment I’ve ever had in my business. It’s crazy how much it freed me up to focus on growth.”
“We tried coaches who cost tens of thousands. Brett was the first to actually change our business.”
“Brett isn’t a coach, he’s the team member we needed to finally scale.”
It’s a breath of fresh air… Brett orchestrated everything so we could focus.”
“Watching you delegate was the most powerful thing. I realized my team could handle more than I thought.”
“You were great at saying, ‘Okay, you’re on this, you’re on that.’ And surprise… the team could do it. That was huge.”
“Now, everyone feels part of a real company… They’re committed to the vehicle, not just us as people.”
“I don’t think we’d have figured this out for years on our own.”
“Brett jumped into the weeds with us… This isn’t coaching, it’s building.”
“Your program and the process you took me through is the only one where I felt, oh my God, I got my money’s worth.”
“I just feel like there’s a huge load off my shoulders now.”
“Night and day different, drastic transformation. It feels like we’re actually running a business.”
“The peace of mind benefits are nearly invaluable.”
“Everybody understands what we’re doing in the team, and we have the process ready. We keep doing it and keep growing.”
“We were able to get a lot more extreme ownership out of team members.”
“All of my employees know what they have to do.”
“I’m able to go and focus on the revenue generating activities.”
“Having more time to work on the things that really will drive the business forward.”
“Fixed years of stagnation in just 60 days.”
“Other agency owners literally envy the systems we have now.”
And I’m really proud of my results!
I helped one entrepreneur who hadn’t taken a full off the grid vacation in 16 years! She toured Europe for a full month, no contact!
Another client took a 3 month (!) vacation to Thailand and Cambodia.
Another is going on a fully unplugged vacation to Japan with his wife in a few weeks.
And some don’t even want to vacation – some skip the trip altogether and just choose to focus on refining their sales with me after their sprint.
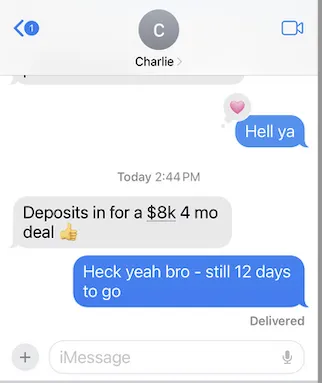
See Charlie who went up market and had his biggest month yet ($34k cash collected in one month)
And Roland who’s now charging $30k for his deals.
And Stephen and Michael who are having their biggest MRR yet with a new product line and growing.
So this really works. And it’s something I’m naturally made for.
And that brings another point – Who am I?
Who Are You And Why Should I Work With You?
Well, I’m Brett, known as the “team whisperer” with a unique set of change management, extraction, complex solving skills, along with the experience to make this 90 Day Vacation Ready Sprint happen.
Here’s a quick overview about me:
Fractional COO and Integrator for 50+ businesses, mostly agencies, perfecting this framework with each iteration. I've made the mistakes and created this proven system that will work for you.
Built a business from the ground up and built myself out. I know what being stuck feels like and how to get out (and how necessary it is to get away)
Johns Hopkins trained counselor, and a rare INTJ personality type. I bring a level of emotional intelligence for teams that most can’t.
D1 competitive athlete and QB of high school football team. I know how to lead teams and have a drive to win.
And I’ve built up all of this experience with one purpose: to serve you.
Now here’s the thing. I can only do this for a limited number of teams at a time, and I don’t want to just assume we are the right fit to work together.
I also want you to have 100% confidence in how I work.
Simply book a call on the link below and let’s have a chat to see.
If you’re not the right fit, I’ll still go all out to solve your #1 ops problem on the call, and send you with action items so that you can reach your goals.
If you are a fit, it will be the best decision you’ve ever made in your life.
I truly look forward to meeting you and helping you achieve the freedom you need to get to your next level.
Dear Creative Visionary Agency Owner,
Here is my promise to you:
If you feel stuck in your business operations, I will remove you as the bottleneck, add systems, and empower your team to take over your business with my 90 Day Vacation Ready Sprint.
By the end of this sprint, you will be confident to board your flight… every loose end accounted for, every detail delegated to your team.
You’ll be free to unplug, refresh, and prepare for the next phase of growth with a systemized business.
Read to the end of this letter to know my exact philosophy, why you're stuck, my proven process that gets results, how to be more profitable, and how to apply to work with me.
If running your business has you stressed, sleepless, and working 60+ hours a week…
If you’re missing time with your family, feeling overworked, frustrated with a B level team, and stuck in what feels like a dumpster fire….This is for you.
In fact, you may have the same thoughts of my past clients. Thoughts like:
“It still feels like I am holding every single ball in the air.”
“Feels like this whole thing is an absolute dumpster fire… looks pretty from the outside, but on the inside it’s a mess.”
“I’m averaging three to five hours of sleep a day.”
“I ended up doing everything anyway… I got really, really burned out.”
“We had a six-figure launch and I made negative $700… because of the team.”
“Anytime something happens… (my team) is always calling ME.”
“I want to be able to disappear for a few days. But I don’t want to come back to a shit show.”
“I wake up anxious every day.”
“I’m working 60-hour weeks and projects are still stuck.”
“I’ve been waking up at 2am in sweats all week”
If any one of these sound familiar, you’ve neglected operations work long enough.
It’s causing you to not be your best.
You aren’t thinking straight. You’re burning all your energy just to keep things from collapsing, and it feels like there’s no way out.
You didn’t start a business to feel this way, to be stuck on a treadmill.
You want a business that can grow without you. One that brings you more happiness and internal fulfillment than an endless conveyor belt of problems.
Well, I want to show you the surefire, fastest way to get you from where you are now to where you want to be.
The 2 Steps To Get Your Momentum Back
There are two things you need to do to get there:
1. You need to recharge your battery. You built this business. You can build it bigger. You just need to get your head clear to do so.
But if you left today, you’d be anxious, nervous, constantly checking slack, and likely come back to a bigger mess than you would have had you stayed.
That means you need to fix the underlying problem:
2. You need to fix your business. You have hidden and complex operational issues that have run wild, growing worse each day, and are ultimately keeping you stuck.
If you can identify these hidden obstacles causing these problems that are keeping you stuck, and fix them at the root, you would be free to take a break and get your head straight.
Luckily, I can help.
Not only did I experience this myself in my own business, and ultimately fixed it to make it self running.
I’ve since obsessed over this problem, serving as a fractional COO for 50+ online founders with remote teams to help fix just this.
And in every case, I found the same 7 systemic issues keeping founders like you stuck.
The 7 Things Keeping You Stuck
Here are the 7 hidden reasons you feel stuck in your business:
Issue 1: You don’t actually know what your team is doing
Who’s doing what? When do they start it? When do they check it off? Proof that it’s done. All questions you aren’t 100% sure on. No one is actually an owner of their roles!
Issue 2: You have no single source of truth or high-level perspective
You just want one holistic place where I can see what the f*ck’s going on in your agency. Because right now it’s freaking everywhere.
Issue 3: You are the default (micro) manager
Anytime something bad happens, your team is calling you, the owner, rather than taking ownership or automatically reporting to a competent number 2.
Issue 4: Everything is stuck in your head and your team’s heads
You still feel like you are holding every single ball in the air. And your team operates in silos.
Issue 5: Problems never get solved at the root
While your business looks pretty from the outside, it feels like an absolute dumpster fire and tangled mess when you get on the inside.
Issue 6: Your documentation is out of date and ignored
You don’t have a comprehensive knowledge base, SOP’s aren’t updated, and you're not sure anyone even follows the SOP’s anyway.
Issue 7: You’re missing critical skills and roles on your team
Your working 60 hour weeks, sleeping 4-5 hours a night doing everyone else’s job.
Here's the secret: If you can successfully fix these 7 issues, you will have a self running business, and the freedom that comes with it.
So, why aren't these fixed yet? There are 4 reasons:
1) You don't know HOW to fix them
2) You don't have the TIME to fix them.
3) You don't have the PERSPECTIVE to fix them (you are IN the system)
4) You are not the right authority to CHANGE the existing culture
This is true for anyone needing any service – just like you deliver for your clients. You need outside help and a proven system to bring change!
Thankfully, that’s exactly what my 90 Day Freedom Sprint does.
This is a one time catalyst that will stabilize your business operations, empower your team to take over for you, and lay the foundation for you so you can take your business to the next level.
My 90 Day Vacation Ready Sprint That Will Change Your Life
Look. Your business isn’t personal. It’s math. Fix the geometry and you fix the profits.
What I do is come in, fix the math for you, and empower your team to take over the business. That’s my secret.
Here’s how my 90 Day Vacation Ready Sprint works in 4 simple steps:
Team buy in: I will get absolute buy in from your team to take ownership, and will extract all info out of them (this is what I do best - I can ask them the questions you can’t). I'll also assess missing roles.
Wireframe. My team and I will build a wireframe of your business using our proprietary 4D Operations Model, so that we have a single source of truth and high level, out of the weeds perspective
Find all gaps and fix. My team and I will create a list of all gaps, issues, and opportunities found, and I will hold your team accountable to fixing them for you week in and week out.
Delegate and document: We will delegate the places you are stuck, and hold your team accountable to updating your knowledge base
And the best part is that it’s made easy for you. You literally just show up to a 90 minute team zoom call once a week, answer questions you already know the answer to, and I’ll do the rest.
We’ll use the labor you’re already paying for to actually do work on your business without you having to do it all yourself. They will be empowered and energized to get behind you (and this is the reason why I LOVE doing this!)
By the end of this 90 days, you will see:
Team Accountability: You'll know exactly what everyone on your team is SUPPOSED to do, WHEN they are supposed to do it, and have CONFIRMATION they actually did it.
Clear Perspective: You'll have a birds-eye view perspective on your business that both you AND your team can align to. A source of truth.
Team of Owners: You'll have an empowered team with an ownership mentality. And we'll remove you as the default micro-manager.
You, Unstuck: You'll know exactly where you are stuck in the business, and I'll help delegate it away for you.
Issues, Systemized: We'll turn the issues that have been plaguing your business for years into systems that keep your business moving forward.
Updated Documentation: We will update and refresh your SOP’s, make team handoffs clear, and ensure a hit-by-a-busable business (and even AI ready)
Real ROI: You’ll make your investment back not only with your time back, but with longer client retention, and operational efficiency to take on more clients.
And not only that, you will come back clear headed with new ideas, and with momentum, ready to take your business to the next level, with systems, team, and clarity in tow.
Real Results of My 90 Day Vacation Ready Sprint
Look, it sounds too good to be true, but I promise you it’s not. You can be confident to take a stress free, “off the grid” vacation in just 90 days, and be refreshed and ready with momentum to drive your business ahead.
It’s no joke!
Here are quotes from real clients after going through their sprint:
“Brett helped us fix years of stagnation in just 60 days. My team now runs without me, and we’re scaling faster.”
“You gelled the team in the first few calls. You brought people together and asked the right questions to get to the root.”
“Our business looks night-and-day different… It feels like we’re actually running a business now.”
“I finally bought back my time and gained peace of mind. That’s nearly priceless.”
“One of the best returns on investment I’ve ever had in my business. It’s crazy how much it freed me up to focus on growth.”
“We tried coaches who cost tens of thousands. Brett was the first to actually change our business.”
“Brett isn’t a coach, he’s the team member we needed to finally scale.”
It’s a breath of fresh air… Brett orchestrated everything so we could focus.”
“Watching you delegate was the most powerful thing. I realized my team could handle more than I thought.”
“You were great at saying, ‘Okay, you’re on this, you’re on that.’ And surprise… the team could do it. That was huge.”
“Now, everyone feels part of a real company… They’re committed to the vehicle, not just us as people.”
“I don’t think we’d have figured this out for years on our own.”
“Brett jumped into the weeds with us… This isn’t coaching, it’s building.”
“Your program and the process you took me through is the only one where I felt, oh my God, I got my money’s worth.”
“I just feel like there’s a huge load off my shoulders now.”
“Night and day different, drastic transformation. It feels like we’re actually running a business.”
“The peace of mind benefits are nearly invaluable.”
“Everybody understands what we’re doing in the team, and we have the process ready. We keep doing it and keep growing.”
“We were able to get a lot more extreme ownership out of team members.”
“All of my employees know what they have to do.”
“I’m able to go and focus on the revenue generating activities.”
“Having more time to work on the things that really will drive the business forward.”
“Fixed years of stagnation in just 60 days.”
“Other agency owners literally envy the systems we have now.”
And I’m really proud of my results!
I helped one entrepreneur who hadn’t taken a full off the grid vacation in 16 years! She toured Europe for a full month, no contact!
Another client took a 3 month (!) vacation to Thailand and Cambodia.
Another is going on a fully unplugged vacation to Japan with his wife in a few weeks.
And some don’t even want to vacation – some skip the trip altogether and just choose to focus on refining their sales with me after their sprint.
See Charlie who went up market and had his biggest month yet ($34k cash collected in one month)
And Roland who’s now charging $30k for his deals.
And Stephen and Michael who are having their biggest MRR yet with a new product line and growing.
So this really works. And it’s something I’m naturally made for.
And that brings another point – Who am I?
Who Are You And Why Should I Work With You?
Well, I’m Brett, known as the “team whisperer” with a unique set of change management, extraction, complex solving skills, along with the experience to make this 90 Day Vacation Ready Sprint happen.
Here are some of my highlights:
Fractional COO and Integrator for 50+ businesses, mostly agencies, perfecting this framework with each iteration. I've made the mistakes and created this proven system that will work for you.
Built a business from the ground up and built myself out. I know what being stuck feels like and how to get out (and how necessary it is to get away)
Johns Hopkins trained counselor, and a rare INTJ personality type. I bring a level of emotional intelligence for teams that most can’t.
D1 competitive athlete and QB of high school football team. I know how to lead teams and have a drive to win.
And I’ve built up all of this experience with one purpose: to serve you.
Now here’s the thing. I can only do this for a limited number of teams at a time, and I don’t want to just assume we are the right fit to work together.
I also want you to have 100% confidence in how I work.
Simply book a call on the link below and let’s have a chat to see.
If you’re not the right fit, I’ll still go all out to solve your #1 ops problem on the call, and send you with action items so that you can reach your goals.
If you are a fit, it will be the best decision you’ve ever made in your life.
I truly look forward to meeting you and helping you achieve the freedom you need to get to your next level.
"You got my team to finally
follow my processes"
"Other coaches gave advice,
Brett actually built the system"
"You turned SOP chaos
into a living playbook"
"I was stuck. Brett found
the real problem, fast"
"I was winging it for years.
Brett finally gave me the systems"
"4 years fighting the same
problems, finally fixed"
"We paid coaches for years.
Brett was the first who actually delivered"
"Brett made the
chaos visual"
Frequently Asked Questions
I’m not an agency, will this work for me?
If you have remote or overseas employees this will work for you. The process is the same, and regardless of industry the trick is in getting your team to explain everything ground up in detail so that an outsider can understand it. That's it!
I've done this for logisitics companies, law firms, MSP's, and other like companies. Agencies just happen to be a speciality of mine. Simply book a call and we can talk!
What other benefits to this process?
This process will update your documentation to prepare you for AI and AI agents.
One of the best use cases of AI is extracting info from a database. Documentation essentially IS a database of your business processes.
If you are curious about how you can apply AI to your business, we can discuss as we offer that service as well.
How do I gain an ROI from this investment in my operations?
If you had 10-20 extra free hours a week, what would you do? Could you innovate products? Create upsells? Drive more prospects into your pipeline? Speak on stages? You should be doing $1,000+ per hour tasks that no one else can do!
And not only will you ROI on your time. You will get more out of your existing team. Just 5-10 more productive, accountable hours per week per team member on a team of 10... that’s 50-100+ more hours per week that can be used to drive your business ahead... all without paying an extra dime.
And those efforts will be more profitable! With efficiencies in operations, you can bring on more clients without having to hire more labor. And with better processes, clients will be happier -- we've seen retention rates skyrocket with this process. If your average retention improves by just a few percentage points, it's literally free money.
This really works! Book a call and let's find that free money together!
Will I need to hire or fire team members?
I don’t know yet! But I will.
If you have questions about your existing team, once I'm in I'll be able to give you my honest assessment on performance and actions.
If there are roles that need to be created, I will help that as well. I've hired over 200 remote and overseas employees for clients over my career. This will be the perfect time to make changes to make your dream team.
Do you stay on through my vacation?
My goal for you is a to clean up your company so that you can have a stress free vacation and come back to a team ready to EAT. I’ll do whatever I have to do to get that result for you. That’s my promise.